Multivariate Analysis in Quantitative Analysis
YARIMIZU Kanetaka
1.
Introduction
Sociolinguistics studies in Japan can be classified into main two groups,
"analysis of variation" and "analysis of discourse". "Variation"
and "discourse" are not opposed ideas in their meaning, but seem to
be opposed to each other in their contexts; while studies of variety rely on
quantitative approach in their main analysis, the discourse studies utilize qualitative
approach. Besides, some fields deal with the langugage itself. (e.g., the study
of the ebb and flow of language, the language policy) This article intends to
scan the process from counting data to multivariate analysis in the studies of
variation, especially focuses on summarizing the data.
2.
Organizing and Counting the Data Surveyed
Any raw data can be invariable for social researchers, for it is impossible for
them to collect all of thier research data which cover all regions and times as
they want by thier own efforts. However organizing the data is dispensable for
varification of assumption, discovery of the patterns, and the detection of
unknown factors out of the data surveyed. Especially in the quantitative
analysis, organizing process is important in its numerical process. In
Oikawa(1999), the significance of adoption of numerical process in the
quantitative process are :
- simplify the
explanation of things and phenomenon
- estimate and discover
the patterns
which are, that is, summarizing the data. The process of quantitative
analysis seems objective, but it is true only in the process of statistical
calculation. Therefore the data form must be standardized prior to quantitative
analysis. In the case of althernative question, quantification is easy but calls
for much care while making the alternatives. In the case of open question, some
criteria need to be set for categorizing the answers. The basic ways of
summarizing data are, for example, simple statistics, cross tabulation.
Conducting only summation, mean and variance of the data by generations,
regions and other attributions can verify a variety of implications and aspects
of the data.
3.
Summarizing by Multivariate Analysis
However, it is hard to grasp and understand the tendency of the group surveyed
with the basic analysis when the raw data contains a lot of items and
questions. For example, Aoki( his Web site )
points out that the basic analysis with the cross tabulations imposes much
difficulty on researchers and it has an unexpected pitfall in case that the
analysis deals with more than two variables. Multivariate analysis is an
alternative statistical method for summarizing a complicated state which human
thought can not trace. It is a statistical technique to abstract the typical
tendency out of large quantities of data. Though its calculation process is
intricate, multivariate analysis has popularized as computers developed.
The major methods of multivariate analysis are as belows:
- multiple linear
regression analysis
(estimate the other variable based on some fixed variables) - discriminant analysis
(determine to which group each data belongs with some fixed variables) - principle component
analysis
(summerize information of multivariate data into a small number of synthetical specific values)
factor analysis
(estimate the common potential factors out of multivariate data)
For Yes-No Data, which is popular for questionnaires, Hayashi's
Quantification Theory is popular in Japan. Each Hayashi's theory I, II, III
corresponds to (1),(2),(3) analysis above. Many guidebooks on multivariate
analysis, such as one written by Ishimura(1992), are available. On the
Internet, Prof. Aoki(Gumma University)'s Web site has solid articles about
statistics (http://aoki2.si.gunma-u.ac.jp/).
This Web site provides self-learning tools and calculating service which users
can calculate statistical work through the CGI Form. These are very useful.
4.
Examples of summerizing data
Kasai(1981) considered how the standard language forms are distributed by
counting the numbers of respondants who use standard forms by every prefecture
with "the Linguistic Atlas of Japan (LAJ)".
The data in LAJ can not be used as it is because the answers of the respondants
in it varies by region by the questions.
Therefore she set the following criteria to arrange them quantitatively:
- limit to standard forms
- put toghther similar
pronunciations to standard forms
- compile areas by
prefecture
Then she transformed the LAJ data into the quantitative data (see table
here)
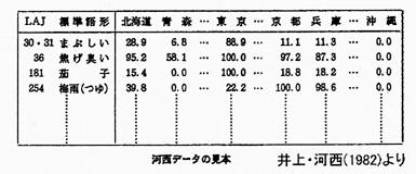
At this stage the data is considerably summerized in comparison with the
original one. With this data, the distribution of the standard forms can be
analyzed roughly. The following is the table of the average ratio of
respondants who use the standard forms in 82 questions by prefecture.
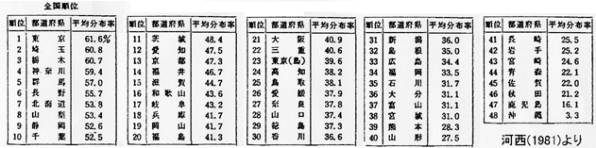
It shows that the standard forms are based on Kanto and Kansai Japanese.
However, as mentioned above, it is difficult to recognize the relations of them
only by looking at the data of 82 questions, Then Inoue & Kasai(1982)
developed the analysis by the multivariate analysis to see the factors behind
the data. In this paper, the matrix of 82 words x 48 districts(47 prefectures
and 1 insular part in Tokyo) was analyzed by factor analysis and the standard
forms are classified into some categories by regions and words. (see fig. here)
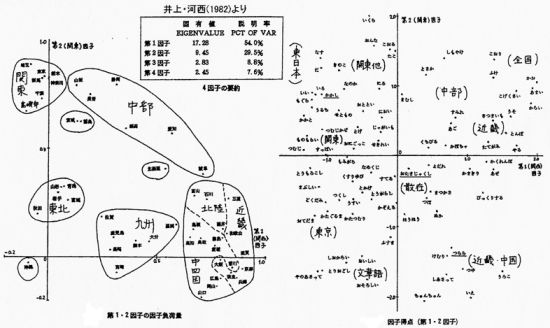
Kasai's data uses only one part of LAJ, but it became suitable for multivariate
analysis due to simple digitalization with fixed criteria. It can summarize
complicated data of LAJ from the viewpoint of standard forms.
5.
Conclusion
The data surveyed enables us to conduct more thoughtful analysis by summarizing
it quantitatively. However, the uncritical attitude to quantitative analysis
has a great risk. The main reasons are the following:
- The numerical data for
the calculation can derive from the experience and knowledge of the
researchers.
(The numeric value does not exist from the beginning) - The result of the
quantitative analysis has, in itself, no meaning for the academic
discipline
(The numeric value tells nothing; consideration, interpretation and explanation are dispensable)
Thus, analyzing without
understanding the problems of statistics may cause mistakes. Especially in
regard to multivariate analysis, most of researchers in humanities course use
it without understanding the process of the statistical calculation due to its
complex computation expression formula. Thus, it is important to understand the
principle of the simple statistical analysis to some extent. Even if it is
difficult for learners to understand them completely, still it is important to
grasp the images of the principle of them with some guidebooks.
References
AOKI,Shinobu (occasionally) "Black Box --- data analysis on the WWW"
http://aoki2.si.gunma-u.ac.jp/BlackBox/BlackBox.html
ISHIMURA Tadao (1992) Suguwakaru Tahenryoukaiseki ToyoTosho
(Easily learning the multivariate analysis)
INOUE Fumio & KASAI Hisako (1982) "Hyoujungokei no Chiriteki Bunpu
Pataan" Kokugogaku No.131
("The Patterns of the geographical distribution of the standard forms in
Japan")
OIKAWA Akifumi (1999) "Suugaku de Kangae, Suugaku de Toku Jinbunkagaku ---
Suuryouteki Bunseki no Susume" Humanities and Information Processing
No.20 Bensei Shuppan
(Human science thinking and elucidate with mathematics --- Recomminding the
quantitative analysis)
KASAI Hisako(1981) "Hyojungokei no Zenkoku Bunpu" Gengo Seikatsu
No.354
("Distribution of the Standard Forms in Japan")
Studies
of Data Analysis In Japanese Linguistics & Dialectology (only a bit)
[Questionnaire,
Statistical Work]
OGINO Tsunao (1994) Ankeeto Chousa Bunseki You Sofutouea GLAPS no Tsukaikata
Dai 2 Han (self-published)
(how to use GLAPS --- software for the analysis of questionnaire data : second
edition)
[the
Way of Investigation and Analysis]
TOKUGAWA Munemasa & SANADA Shinji (1991) Shin Hogengaku o Manabu Hito no
Tame ni Sekaishisosha
( For the Learners of the Dialectology : New Edition)
MIYAJI Yutaka, KAI Mutsuro, NOMURA Masaaki & OGINO Tsunao (edit) (1997) Handobukku
Ronbun,Repooto no Kakikata Meijishoin
(Handbook how to write papers)
[Linguistic
Atlas]
FUKUSHIMA Chitsuko & FUKUSHIMA Yusuke (2001) Pasokon ni yoru
Gengochirigaku: Sono Houhou to Jissen SEAL Yuuzaazu Manyuaru Dai 5 Han (SEAL
version 6.0 for Windows98/Me/2000) Report for the Grant-in-Aid for
Scientific Research from the Ministry of Education, Science, Sports and Culture
(Geographical Linguistics by PC : Method and Practice SEAL Users Manual 5th
Edition (SEAL version 6.0 for Windows98/Me/2000))
*SEAL is released at her Web site ( http://www.nicol.ac.jp/~fukusima/inet/lg.html
)
[Exmples]
DB-West (1995) Pasokon Kokugo-Kokubungaku Keibunsha
(Personal Computer for Japanese Language and Literature)
SANADA Shinji & LONG Daniel (1997) Japanese Sociolinguistics Illustrated
Akiyama Shoten